Cycling grade bike ride difficulty
calculator Cycling in Scotland England Wales Fife
Perthshire Aberdeenshire Banffshire Mountain, Road and Hybrid Bikes
Here are links to a few of our cycling trips: (see <https://balmerino.ddns.net/cycling-routes>
for all of our routes), <The Scottish Borders>, <The Reiver’s Way>, <C2C>,
<Northumberland>,
<North
Wales>, <Yorkshire>, <The
English Lake District>, <Perthshire>,
<Aberdeenshire>
Julie
and Lance’s Cycling Grading System: How we grade and what the grades mean.
The grading method we use is based upon a notional
calorie count for the route: the more calories used the higher the grade for
the cycling.
The Grading Calculator is available as a
spreadsheet, <https://balmerino.ddns.net/cycalc.xlsx>.
This calculator will work on most computing devices that will run Microsoft
Excel 2010 or more recent. The algorithm used in the calculator is specific to
the values established using Google’s mapping tools. There is also a grade
chart at the bottom of this page that has been produced using our Grading
Calculator for a range of distances and height of ascent.
The algorithm used in the calculator emerged from
the analysis of many hundreds of cycle rides over a range of distance and
difficulty. I use a Garmin Edge200 GPS as my reference, and with it I have
measured the ascent figures for a large number of rides, the results of which
are then compared with the ascent values predicted by Google Earth.
A predicted grade for a ride cannot, obviously,
include actual GPS measured values. The biggest problem is estimating the
height climbed – all mapping systems and software have unavoidable disagreement
when establishing a value for height of ascent and decent for a cycling route –
a few minutes research on the web will explain the difficulties. In Cyclac,
using Google Maps and Google Earth, I have found the height difference between
Google and my Garmin Edge200 GPS conforms closely to a normal distribution with
a standard deviation of ~190ft for distances in the range 10-miles to 46-miles.
In all cases my question has been how to best bring the estimated climbing
using GM and GE into line with my direct measurement using an Edge200 GPS.
Google Maps provides tools to plot routes and Google
Earth can takes these routes and quickly provide a value for ascent and decent.
Distance cycled and measurements of ascent are the two most important figures
for grading a route. How these grades sit subjectively with the individual
cyclist is down to the cyclist: an elite cyclist will have a completely
different view to that of ‘ordinary folk’ (the likes of Julie and me).
Therefore our cycling grades are for casual hobbyist cyclists, and try to
express how much effort we feel for the cycle ride.
We grade the rides: ‘A’ (ambling), ‘B’ (bearing),
‘C’ (challenging), ‘D’ (demanding) and Ex (extreme). Each grade letter is
further refined by: mild, average and hard. And the extreme grade has three levels:
1, 2 and 3 – the hardest cycle ride we have ever done provided the boundary for
grade Extreme: Ex1(68W). The ride was completely
exhausting! And neither Julie nor I can imagine ever doing anything harder.
I’ve included Ex2 and Ex3 as extrapolations on the grading system – if you ever
do a route greater than that, please let me know.
How hard a bike ride is ‘on the day’ has other
factors: was it windy, were you pushing hard to test yourself, etc. Therefore
the grading system assumes no wind and an average 60Watts of power used during
the bike ride (60Watts is around 250kCal of exercise per hour for the average
person). The bike itself is also a factor: we assume gearing of ratios you get
on mountain-bikes and hybrid-bikes – in other words, rarely do you have to be
out of the saddle to push yourself uphill.
Roads in the UK have a large range of ascent verses
distance, but averaging around 50ft per mile. At 50ft/mile cycling power of
around 60Watts ‘feels’ right. However if the average height -v- distance
becomes greater than approximately 80ft/mile, then 60Watts is not high enough a
power to ride the road – elevated power is needed, and the grading system takes
that into account.
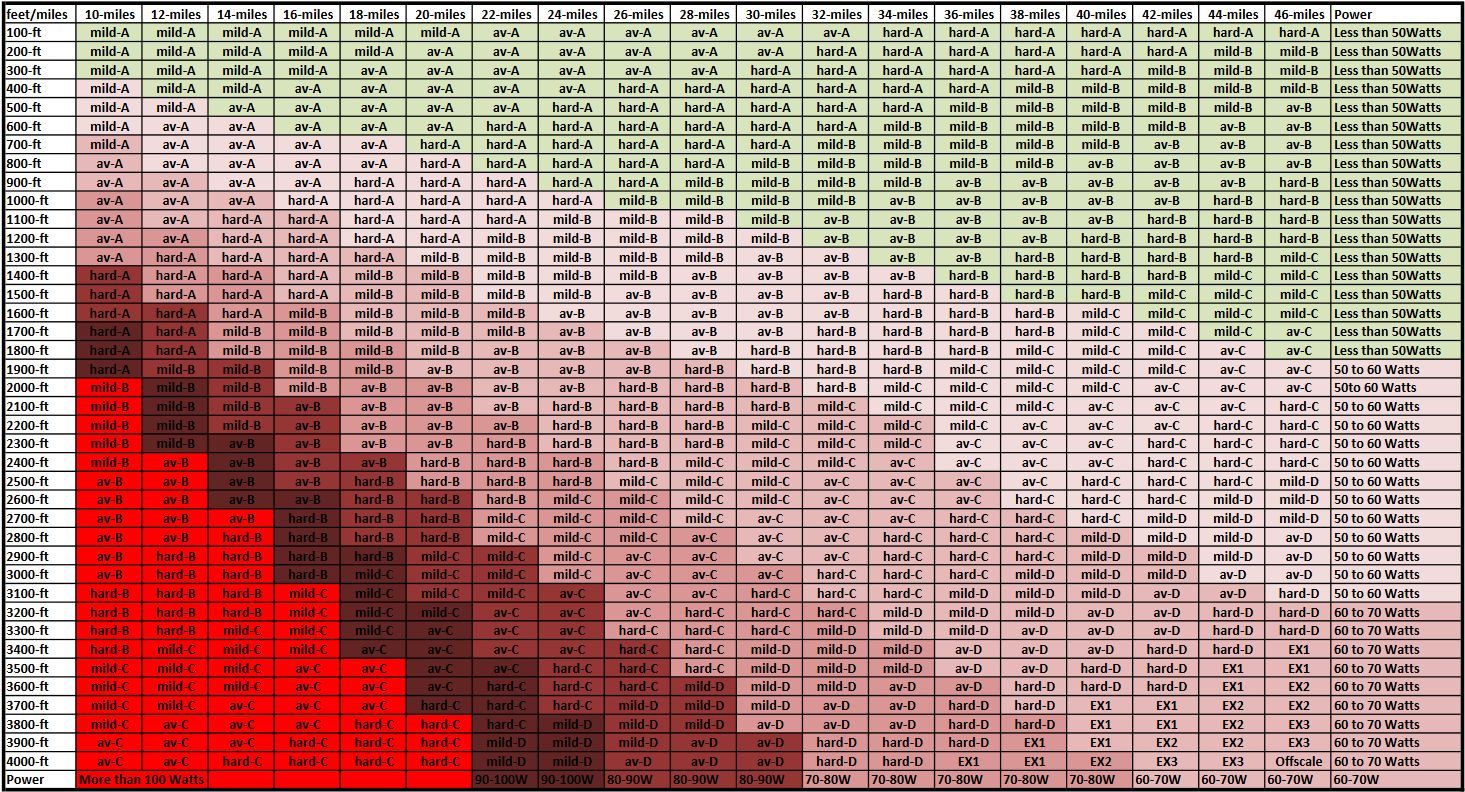
Below is a chart for cycle rides between 10 and
46-miles and using Google Earth for estimating the height ascended. The colour
coding depicts the average power with respect to distance and ascent. Salmon
colours and red are harder than 60-Watts rides, where red are rides require
more than an average 100-Watts. For example, 20miles with 1500ft of ascent,
grade mild-B, will most likely average 60-Watts. At greater ascent figures for
the 20miles example the effort will increase: at 2800ft of ascent 85-Watts will
most likely be the average power, making an otherwise mild-B route into a hard-B(85W) – bordering on a Challenging grade.
The green routes are easier (lighter the green the
easier), the salmon coloured routes are harder (the darker colours are harder)
and the brown and red routes are, potentially, very hard.
“Beyond pain there is a whole universe of
more pain” Jens Voigt, professional cyclist and broadcast commentator.
<https://balmerino.ddns.net/cycling-routes> for all of our cycling routes and contact details.